◆MIKE

MIKE / Evidence

MIKE — Evidence

See the measured latency, real console captures and technical diagrams, with the limits visible.

◆Measured latency

The measured voice path.

The complete path from the end of speech to the first sound is still above target.

Stage / ÉtapeP50P95
End-of-turn504 ms804 ms
First text (model turns, n = 44)1,711 ms4,254 ms
First TTS audio (Kyutai)940 ms1,254 ms
Speech end → first sound (composed)2,919 ms5,827 ms

78 turns across 20 sessions, 29 September–2 October 2026. These are measured snapshots, not a live service guarantee.

Full-path target: P50 ≤ 1.0 s and P95 ≤ 1.5 s. Status: not yet at target. The stages are separate measurements and must not be added together.

Read the measurement dossier (PDF) →

◆Captures

Three captures of the real system.

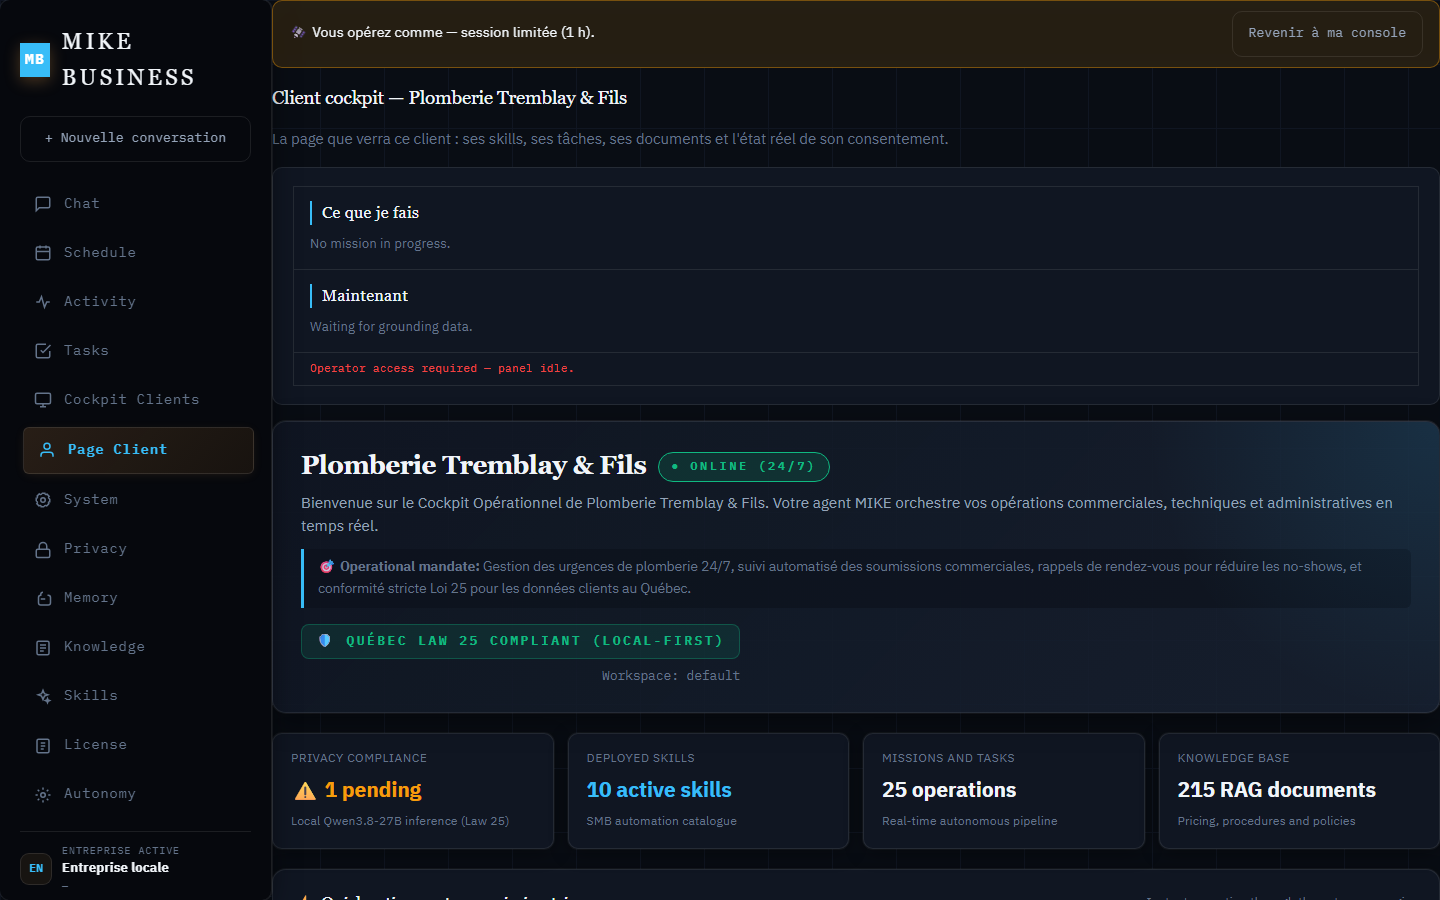
MIKE owner console: the client cockpit of a plumbing business, with the Law 25 banner, the consent panel and the knowledge-base totals.
Owner console, 23 Aug 2026
MIKE runtime editor: the service and price sheet the voice agent reads, with ranges instead of final prices.
Runtime editor, 2 Oct 2026
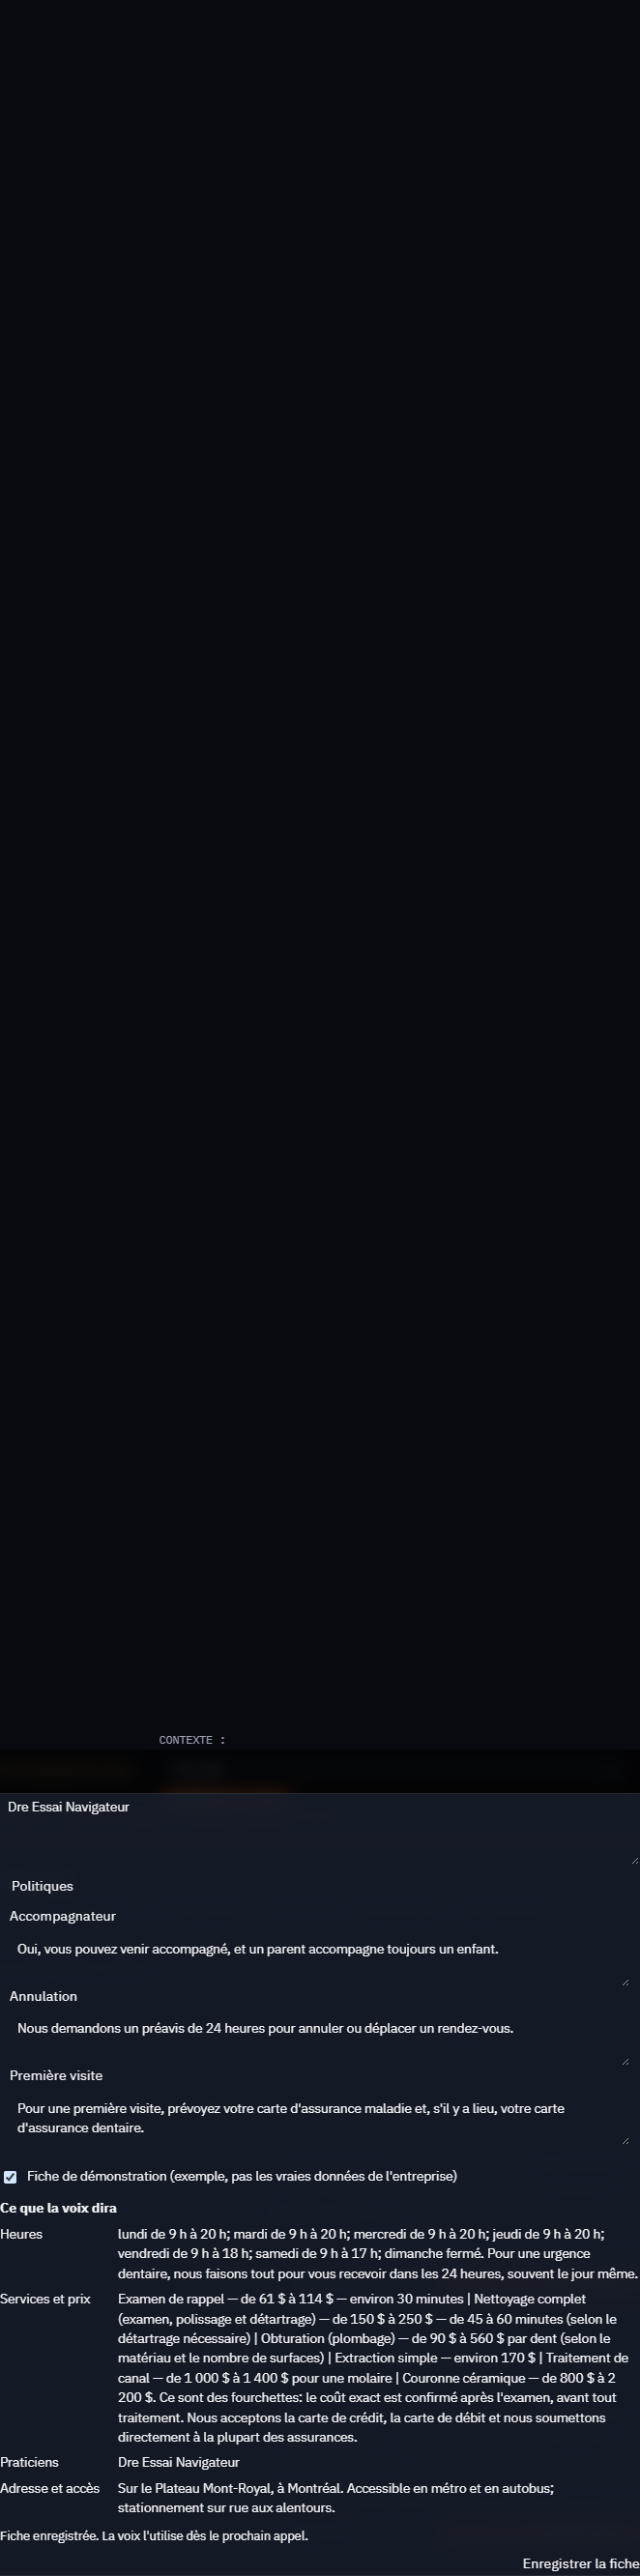
MIKE call panel: a recorded call sheet — hours, policies, services and prices — that the voice agent uses on the next call.
Recorded call panel, 2 Oct 2026

Each capture opens at full size.

◆Diagrams

Nine diagrams, from the technical dossier.

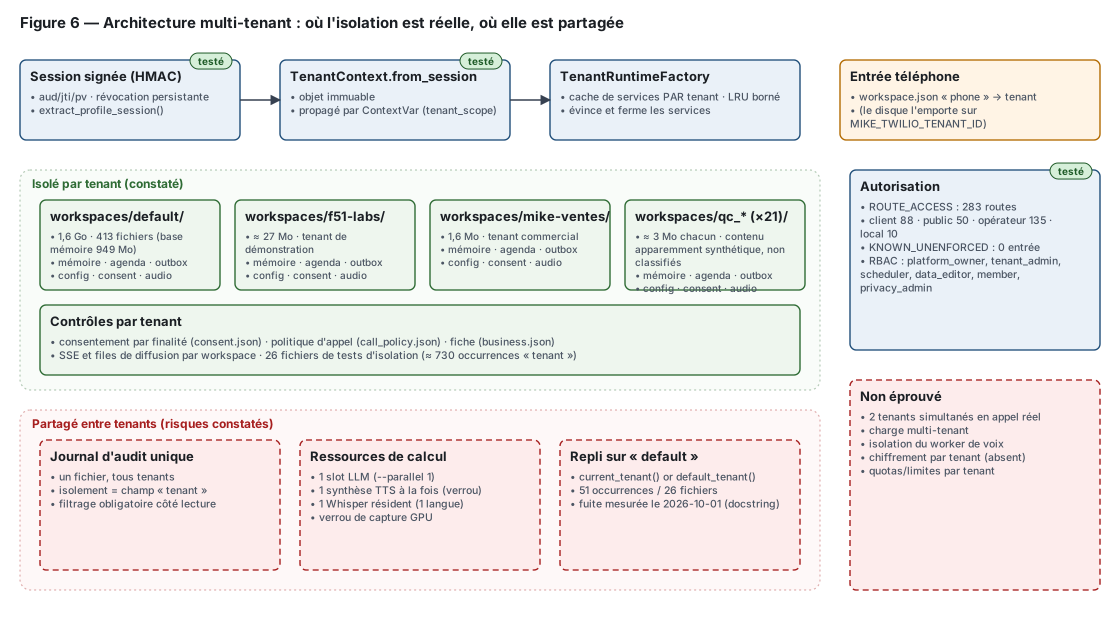
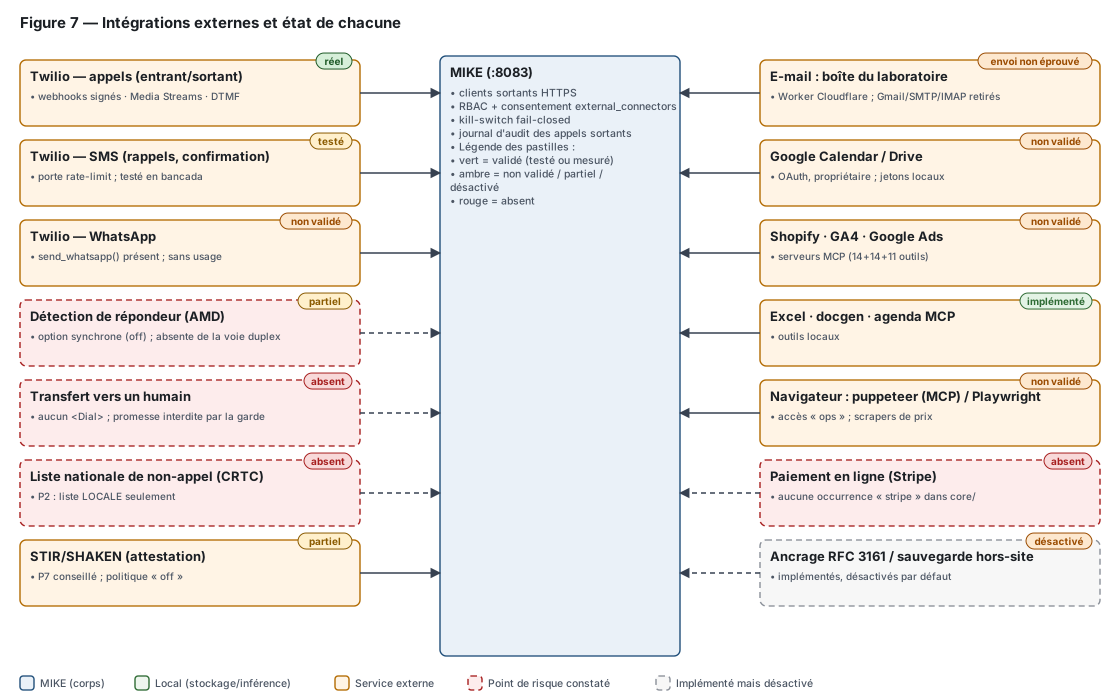
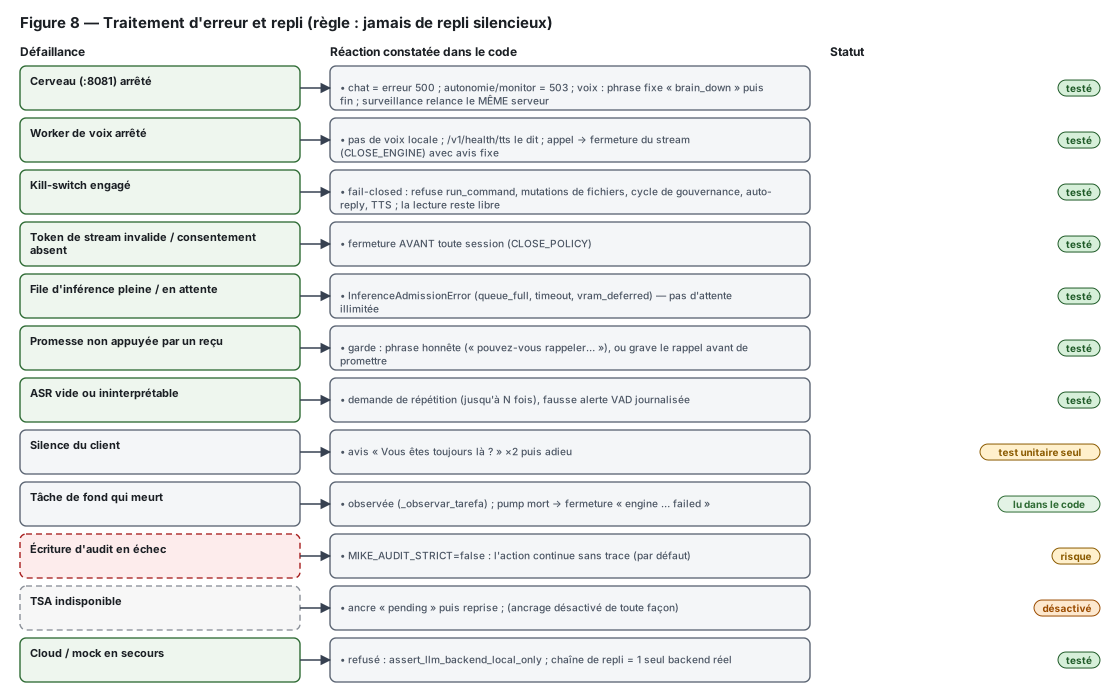
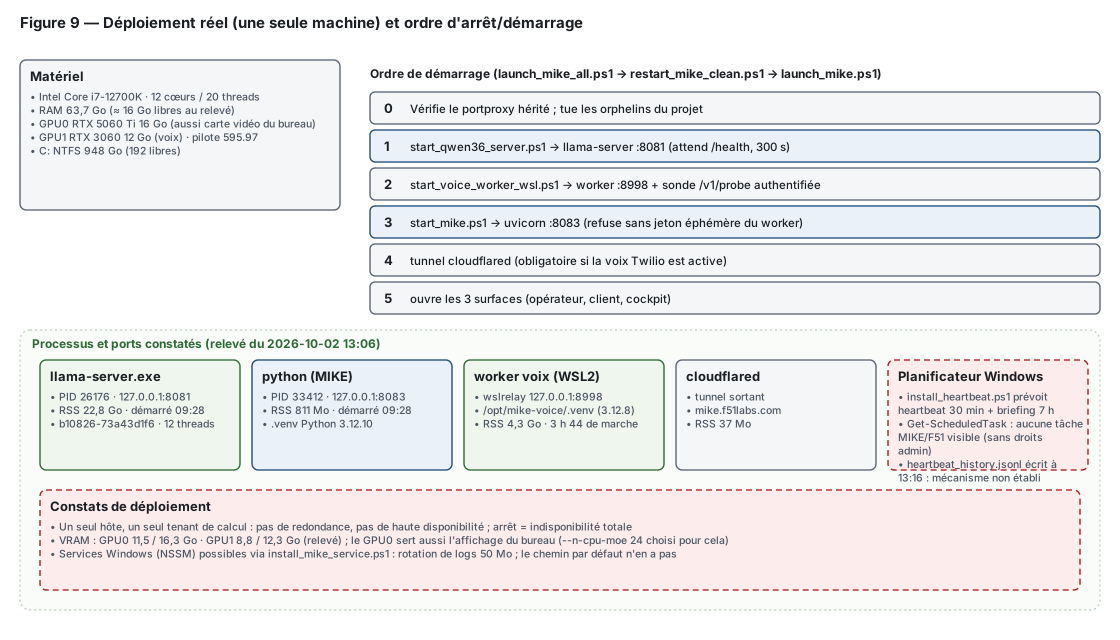
Diagrams from the technical dossier, dated 2 October 2026. They mark what is measured, disabled and not validated.
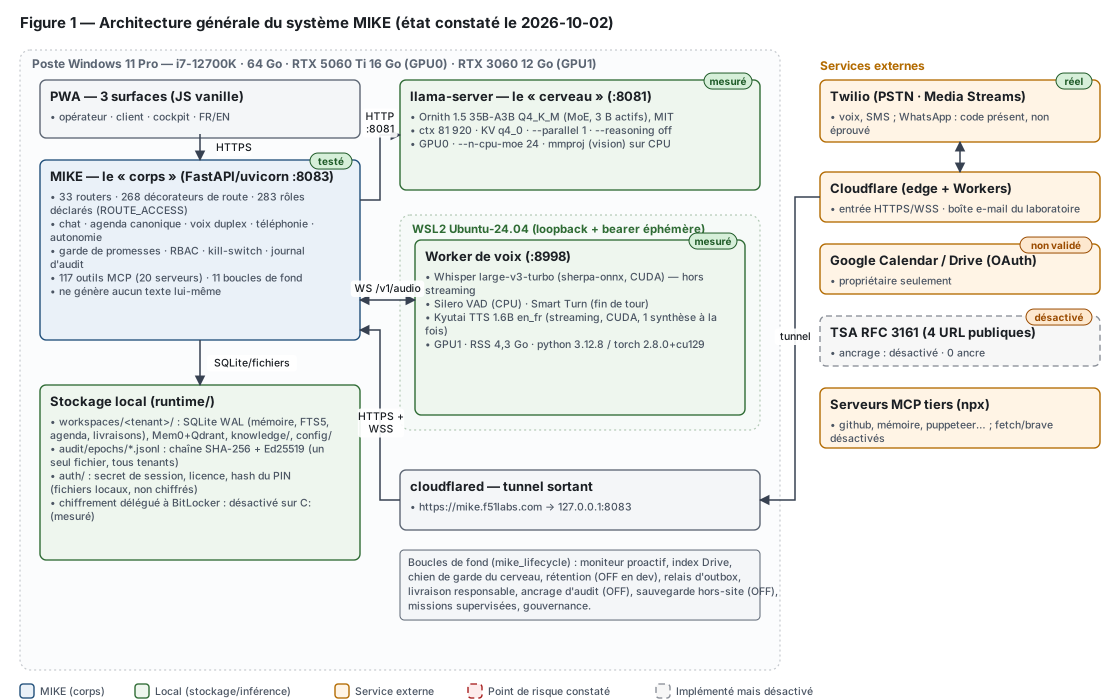
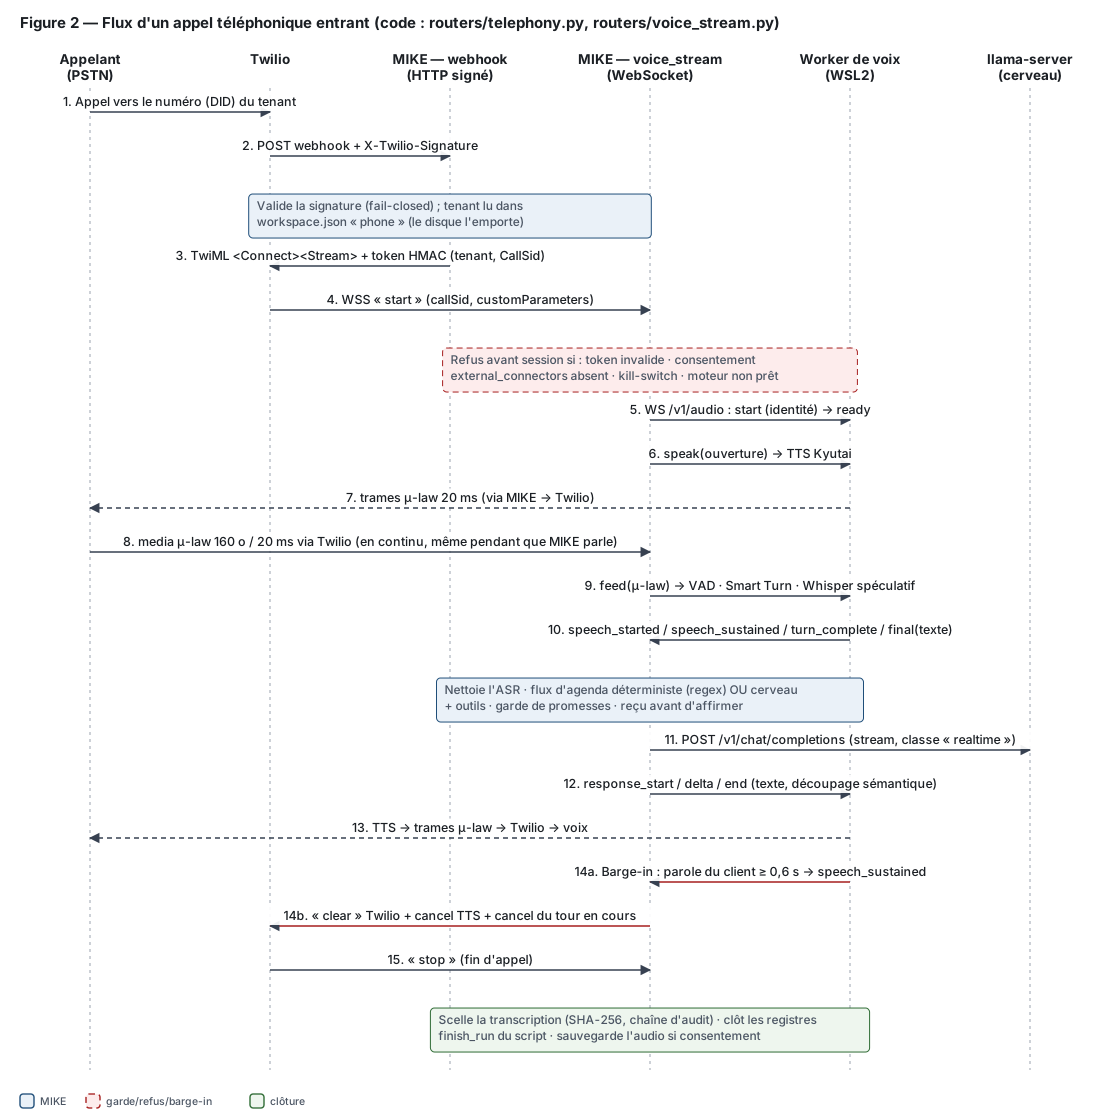
Diagram 1 — general architecture: the Windows workstation, the three PWA surfaces, the FastAPI body and the local brain.
General architecture
Diagram 2 — an incoming phone call, from the caller through Twilio to the signed webhook.
Call flow
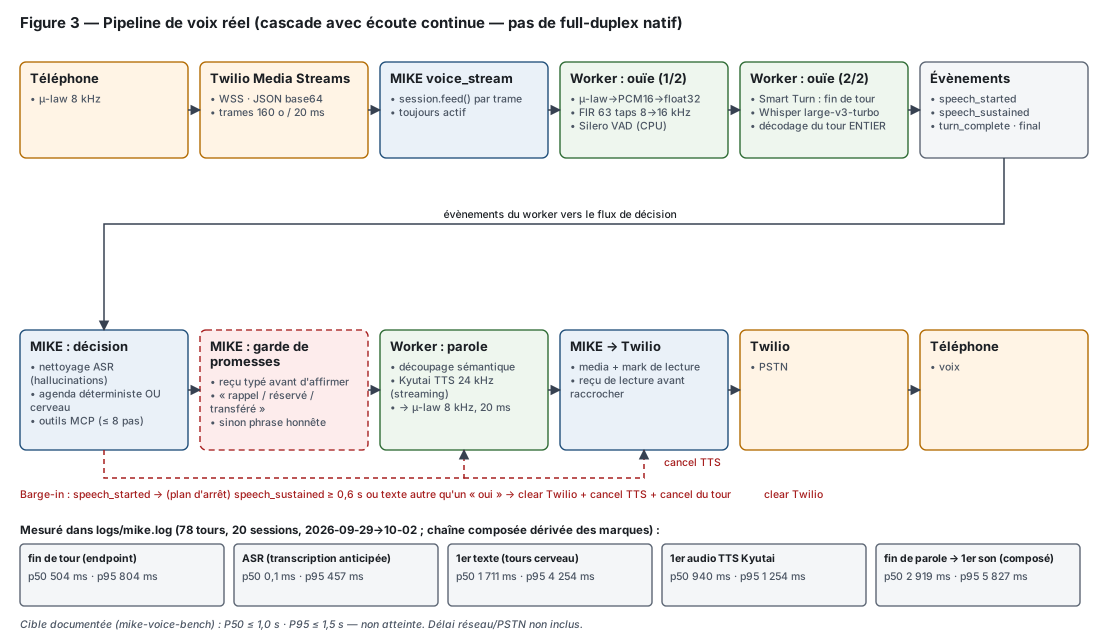
Diagram 3 — the real voice pipeline: a cascade with continuous listening, not native full duplex.
Voice pipeline
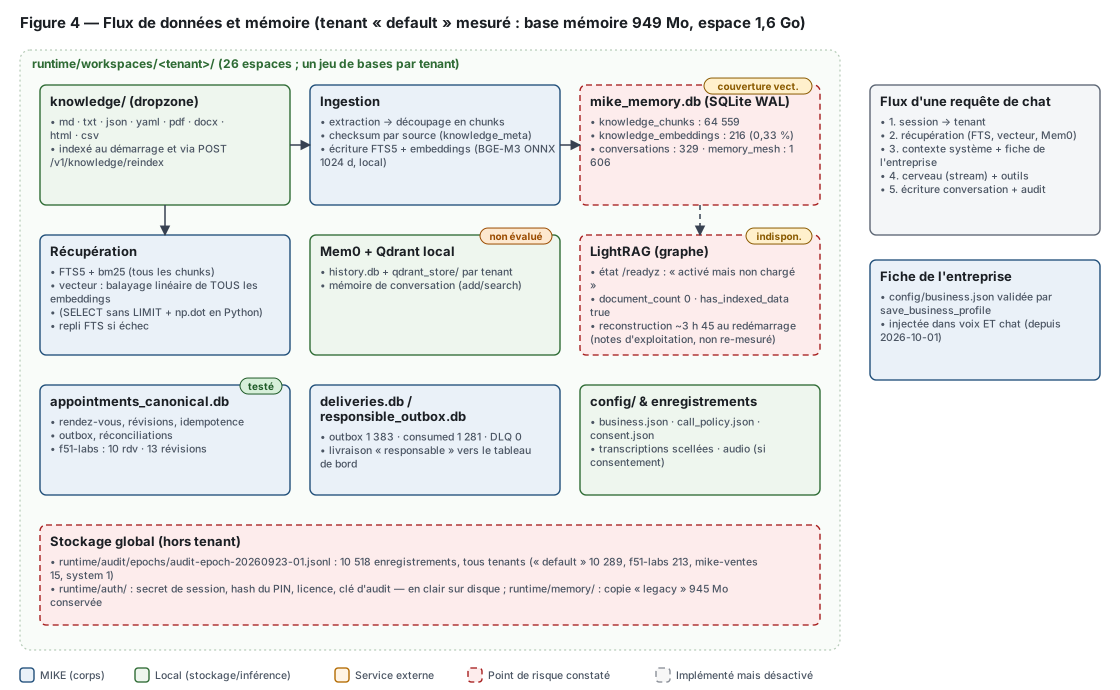
Diagram 4 — data and memory flow for the measured tenant: knowledge dropzone, memory databases and index.
Data and memory
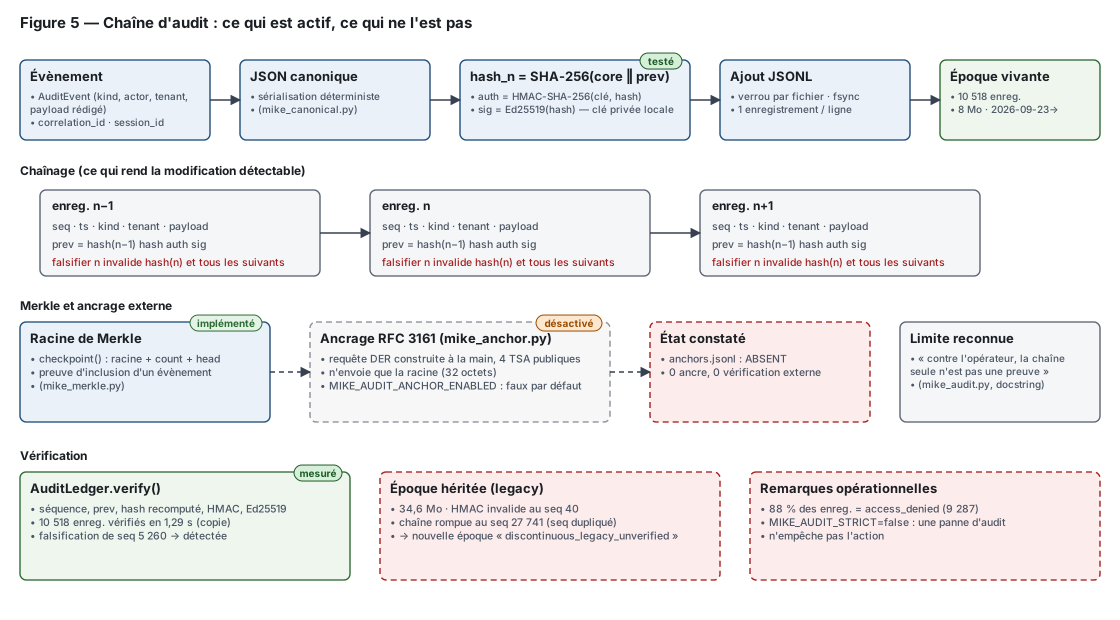
Diagram 5 — the audit chain: what is active and what is not.
Audit trail
Diagram 6 — multi-tenant architecture: where the isolation is real and where it is shared.
Multi-tenancy
Diagram 7 — external integrations and the state of each one.
Integrations
Diagram 8 — error handling and fallback, under the rule that there is never a silent fallback.
Error and fallback
Diagram 9 — the real deployment on a single machine, with the stop and start order.
Deployment
◆Dossier

The full dossier.

MIKE dossier technique · 2.1 MB

Read the technical dossier (PDF) Back to the MIKE page