◆sections
The problem
A mixture-of-experts model activates only a fraction of its weights per token, so the constraint is not model size but where each expert lives at the moment it is needed. On a 16 GB card an 80B MoE cannot hold its experts, and the default fix is to compute them on the CPU (llama.cpp --cpu-moe) or to stream them over PCIe.
The thesis
The project's claim was that consecutive tokens re-select many of the same experts, so a small VRAM cache of the hot expert set should remove most of the PCIe traffic, letting an 80B model run on a consumer GPU. The model documented in the records is Qwen3-Coder-Next 80B IQ4_XS: 48 layers, 512 experts per layer, 10 active plus a shared expert, 262,144-token native context, loaded with -ngl 999 --cpu-moe -c 262144 -fa on.
- Model identity and architecture: Qwen3-Coder-Next 80B IQ4_XS, 48 layers, 512 experts (10 active + 1 shared), 262,144 native context
.claude-deep/projects/C--Users-marco-Desktop-SuperEzio-Arbitro/memory/nitro-80b-checkpoint.md (2026-05-25) · recorded in project memory - Working server flags: -m Qwen3-Coder-Next-IQ4_XS.gguf -ngl 999 --cpu-moe -c 262144 -fa on --reasoning off
nitro-80b-checkpoint.md:24 · recorded in project memory - Consumer-hardware framing: RTX 5060 Ti 16 GB + 64 GB DDR5; expert size 59 MB (IQ4_XS)
session 2026-05-25 (rollout-2026-05-25T20-54-01-019e61c6-391a-75b0-adee-0128be6f2a9d.jsonl), agent reference doc echoed in the transcript · recorded in session transcript
The method
Three instruments: a Layer-1 expert-persistence cache patched into a local llama.cpp fork, a standalone cache-policy simulator driven by captured router traces, and a benchmark protocol that runs the same model in three modes (CPU-only, GPU-all, --cpu-moe with the cache) across a context ladder.
Layer 1 - expert persistence cache
The cache is a fixed pool of VRAM slots per MoE tensor with an LRU-FREQ eviction policy: a struct f51_moe_tensor_cache holding expert_to_slot / slot_to_expert maps, a per-slot frequency counter, last-used timestamps and hit/miss counters; choose_slot() scores freq * 1000 - age; frequencies decay by 0.75 every 2x capacity misses; ensure() does lookup, evict, cudaMemcpyAsync H2D and returns the slot. It is wired into ggml_cuda_mul_mat_id() and gated by environment variables (F51_MOE_CACHE_CAPACITY, F51_LAYER1_ENABLE). The startup line it prints is 'F51 cache: %d slots x %zu MB = %zu MB VRAM'.
- Struct, policy functions, env vars and the exact 'F51 cache: %d slots x %zu MB = %zu MB VRAM' log line
session 2026-05-25, patch diff and binary-strings inspection quoted in the transcript · recorded in session transcript - File locations in the fork: common.cuh (cache), ggml-cuda.cu (MUL_MAT_ID hook), f51_nitro.cuh (5-layer orchestrator, Layer 1 enabled by default)
memory/f51-code-map.md (2026-05-27) · documented, source files deleted from disk - Planned footprint: 16 slots per tensor x 59 MB = 944 MB VRAM
session 2026-05-25, experiment plan quoted in the transcript · recorded in session transcript
The simulator
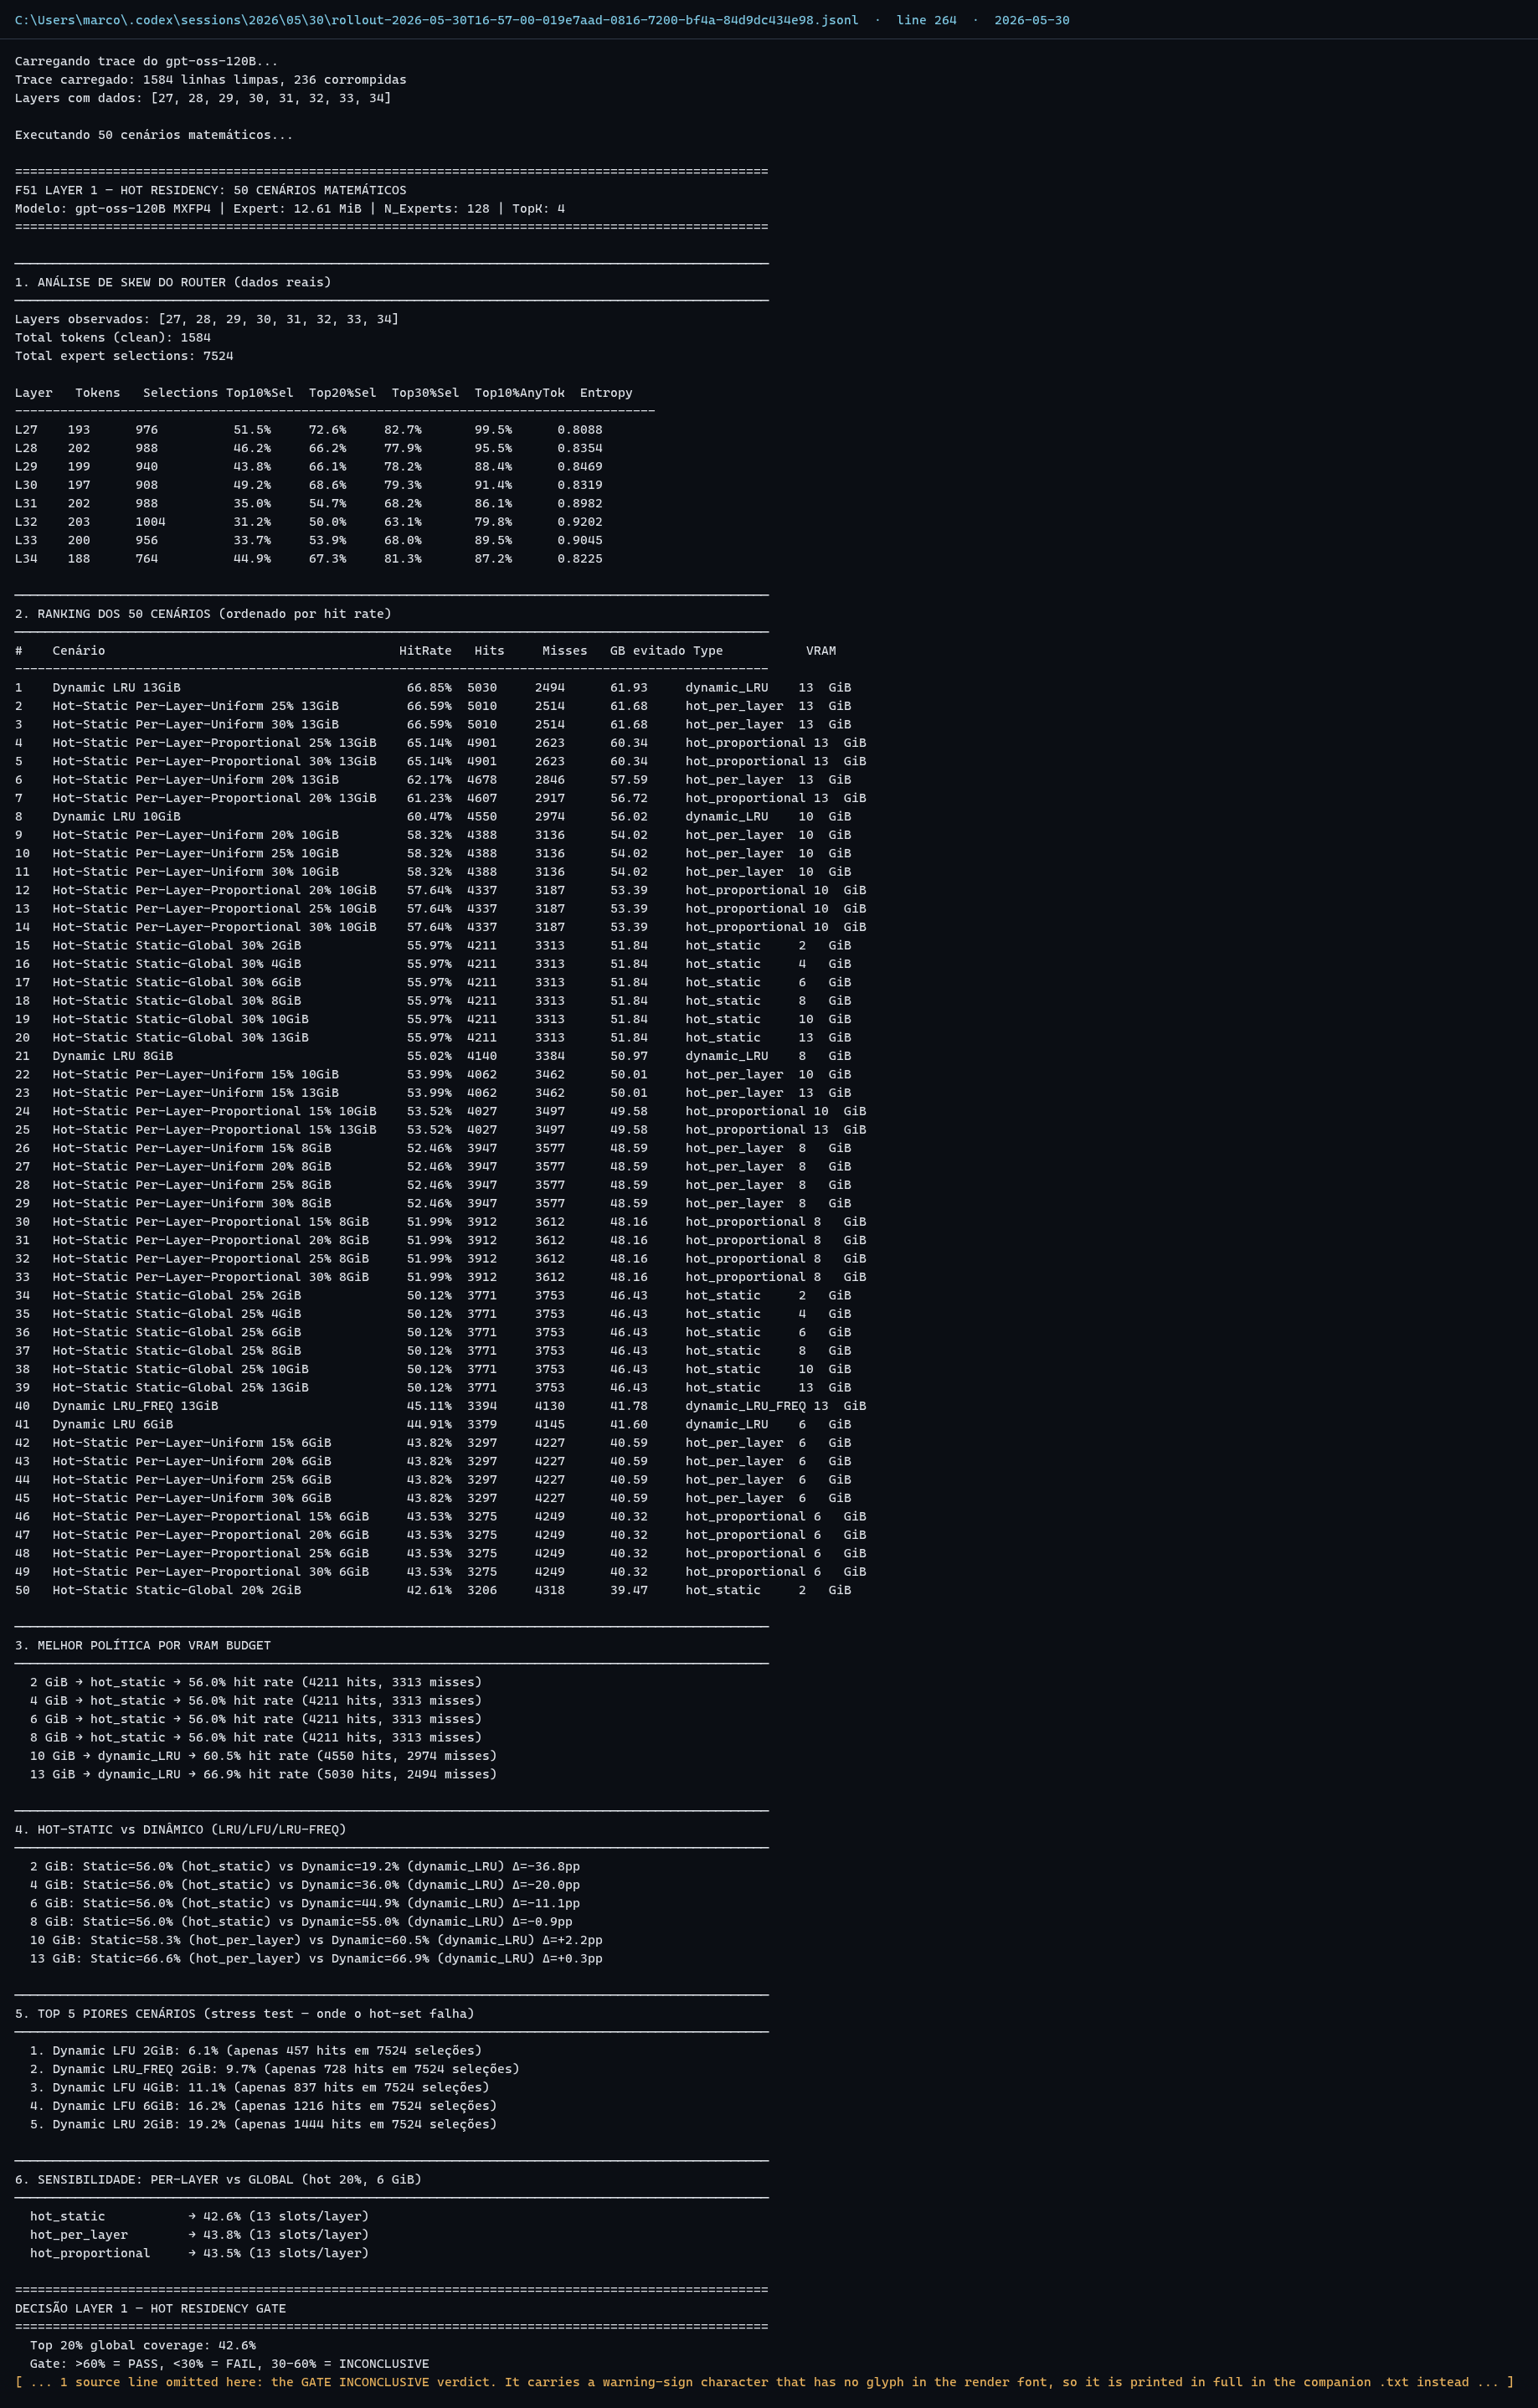
f51_cache_sim.py is a standalone eviction-policy simulator over captured router traces. It computes per-layer router skew (what share of expert selections lands in the top 10/20/30% of experts, and how many tokens touch that set at least once), then replays 50 capacity/policy scenarios across the observed layers and ranks them by hit rate. It is the piece that survived in the session record: a full run against a gpt-oss-120B MXFP4 trace (128 experts, top-k 4, 12.61 MiB per expert, 1584 clean trace lines) printed its complete ranked table.
- 'F51 LAYER 1 - HOT RESIDENCY: 50 CENARIOS MATEMATICOS' output, including the full 50-scenario ranking, the 'MELHOR POLITICA POR VRAM BUDGET' summary (56.0% at 2/4/6/8 GiB, 60.5% at 10 GiB, 66.9% at 13 GiB) and the per-layer skew table
session 2026-05-30 (rollout-2026-05-30T16-57-00-019e7aad-0816-7200-bf4a-84d9dc434e98.jsonl), line 264; published as figure fig-01 on this page · recorded in session transcript - The same run also printed a second, earlier sweep and a speculative-prefetch test (TESTE 1 and TESTE 2, same file, line 263): a static hot+warm sweep reaching 89.4% at Static Top50% (512 slots, 6.3 GB), and a prefetch table where the ensemble-buffer strategy lifted hit rate 26.0% -> 31.4% at C=4 and 75.0% -> 77.0% at C=32 while the last_token strategy moved +0.0pp at every capacity
session 2026-05-30, line 263 · recorded in session transcript - A caveat carried by the run itself: the header counts 'Total de cenarios simulados: 108' while the ranking lists 50 and the title says 50 - the three numbers in the same output do not agree, so '50-scenario' is the label the script gave itself, not a count that was reconciled
session 2026-05-30, line 264 (first and last lines of the same output) · recorded in session transcript; noted 2026-10-03 - f51_cache_sim.py lived at (local source: f51_cache_sim.py) (git status showed it untracked)
memory/f51-code-map.md:67; session 2026-05-26 (rollout-2026-05-26T20-01-49-019e66bc-b825-7e72-99aa-c558521cc84e.jsonl) · file deleted from disk; path recorded - Simulator structure, read from the script itself in the session record: N_SCENARIOS = 50, ten scenario types (including 'Qwen-realista (head+mid+tail)'), six eviction policies ranked at the target capacity (LRU, LRU_FREQ, FREQ_DECAY, LEAST_COUNT, LFU, OPT/Belady) and a capacity sweep over C=16/32/48/64/128, reporting hit rate, H2D copies per token, gap to OPT and working-set coverage
session 2026-05-26 (rollout-2026-05-26T20-01-49-019e66bc-b825-7e72-99aa-c558521cc84e.jsonl), simulator source read into the transcript · recorded in session transcript - A later session (2026-05-29) flagged the 120B trace as unreliable: 1838 lines of which 363 invalid, only layers 27-35 observed, top_k=128/256 ids and negative ids at the end
session 2026-05-29 (rollout-2026-05-29T16-44-25-019e757b-24c1-7303-a398-755702310e3f.jsonl) · recorded in session transcript
Benchmark protocol
The protocol required three modes per model - CPU-only (-ngl 0), GPU-all (-ngl 99), and the Nitro mode - plus a context ladder (4K, 16K, 32K, 128K, 256K, 512K, 1M) with no skipped steps, and a per-run checklist recording model, hash, quant, exact command, llama.cpp version, context, token counts, tok/s, VRAM, RAM and the stderr log. The ladder and checklist survive only as notes.
- Three-mode protocol, context ladder and per-run reproduction checklist
memory/nitro-moe-protocol.md (2026-05-25) · recorded in project memory - Invocation with the cache on: $env:F51_MOE_CACHE_CAPACITY = '64' before llama-server
memory/f51-code-map.md:88 · recorded in project memory
The result
What the records show is not a speedup. The cache compiled, but on the real serving path it never engaged; the throughput the project was promoted with came from the CPU-compute path with no cache involved; and every run in which the cache was actually active was slower than the baseline, with one capacity producing corrupted output.
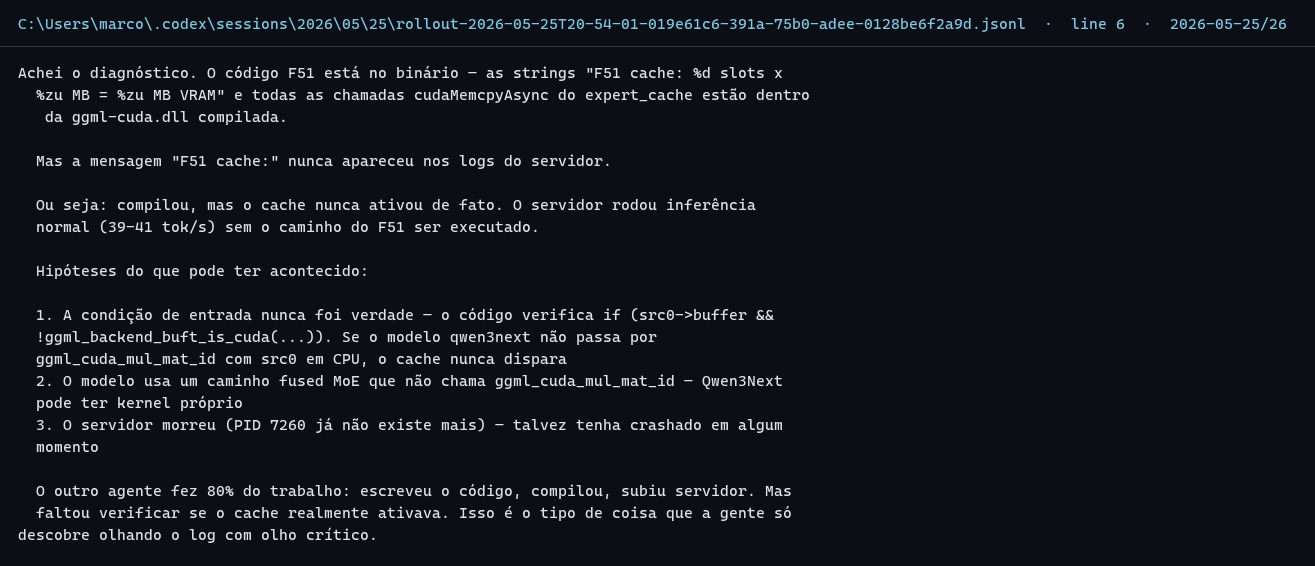
The cache never fired in the server
The Layer-1 patch was compiled into the CUDA library - the strings 'F51 cache: cudaMalloc %zu MB failed' and 'F51 cache: %d slots x %zu MB = %zu MB VRAM' are present in ggml-cuda.dll - but the initialisation line never appeared in any server log. The root cause was isolated with a debug log: with --cpu-moe the MoE experts report buffer buft='CUDA0', so the guard condition that should route experts through the cache never becomes true. The server was therefore running plain inference at 39-41 tok/s with the F51 path completely unused. A separate diagnostic run of the cache instrumentation opens with hits=0, misses=145, reuse_pct=0.0 and saved_mb=0.000 on the cold fill of every tensor; the second, warm pass over the same tensors inside the same output reports reuse_pct from 20.0% to 99.1%. Both passes are on this page (figure fig-06) because the cold-pass quote alone reads as a stronger claim than the record supports.
- Compiled but never activated: 'compilou, mas o cache nunca ativou de fato. O servidor rodou inferencia normal (39-41 tok/s) sem o caminho do F51 ser executado'
session 2026-05-25 transcript (monitoring agent's verdict, quoted verbatim) · recorded in session transcript - Root cause: 'is_cuda=1 - Os experts MoE estao reportando buffer CUDA0, mesmo com --cpu-moe ... o cache F51 nunca entra'
session 2026-05-25 transcript · recorded in session transcript - Instrumented run, first observation of each tensor: hits=0 misses=145 reuse_pct=0.0 base_groups=105 copy_groups=105 base_mb=77.082 saved_mb=0.000
session 2026-05-25 transcript (diagnostic output); see figure fig-06 in this page · recorded in session transcript - The same diagnostic is NOT uniformly zero and must not be read as 'the cache never worked': it is a cold fill followed by a second pass. Rows [0] to [140] (blocks 0 to 46, gate/up/down) all report hits=0, reuse_pct=0.0, saved_mb=0.000; rows [141] to [239] re-observe the same tensors warm and report reuse_pct from 20.0% to 99.1% (row [141] blk.0.ffn_gate_exps.weight: used=107 hits=106 misses=1 reuse_pct=99.1 base_mb=56.885 copy_mb=0.532 saved_mb=56.353). The quote above is the cold pass only.
session 2026-05-25 (rollout-2026-05-25T20-54-01-...jsonl), line 940, all 234 surviving rows parsed; figure fig-06 and its companion assets/nitro-moe/fig-06-diagnostico-hits.txt carry the full text · recorded in session transcript; verified row by row on 2026-10-03 - The record is itself lossy here: the capture reports 'Total output lines: 240' but rows [115] to [120] are destroyed mid-line (the raw text reads '[115] tensor=blk.38.ffn_up_exps.weight backend=C...217 tokens truncated...'), so only 234 of the 240 rows survive anywhere on this machine. The six missing rows sit inside the cold pass, where every surviving neighbour reports hits=0.
session 2026-05-25, line 940, raw JSONL inspected character by character on 2026-10-03 · verified on disk
When forced on, the cache was slower - and once corrupt
The benchmark table kept in the project (and echoed by the agents at the time) compares three configurations: --cpu-moe alone at 40.8 tok/s with correct output and 2 GB VRAM; --cpu-moe plus the F51 cache at capacity 64 with offload at 8.1 tok/s with corrupted output (CUDA event-reuse bug); and the fixed version at capacity 128 at 5.2 tok/s with correct output and about 4 GB VRAM. The explanation recorded at the time: under --cpu-moe the expert weight never crosses PCIe, so there is nothing for a VRAM cache to save; the CPU computes the small expert matmuls directly.
- Benchmark table: --cpu-moe 40.8 tok/s / cache C=64 8.1 tok/s corrupt / cache C=128 5.2 tok/s correct
session 2026-05-28 (rollout-2026-05-28T18-21-09-019e70ad-5acb-7022-8109-149063e68895.jsonl), project pitch table quoted in the transcript; identical table in memory/f51-cache-benchmark.md (2026-05-27) · recorded in session transcript and project memory - '--cpu-moe puro = 40,8 tok/s, com cache = 5,2 tok/s (8x mais lento)' and the reason (no H2D to optimize in that mode)
session 2026-05-28 (rollout-2026-05-28T22-13-06-019e7181-b377-7242-82de-02f74484afe0.jsonl) · recorded in session transcript - Corruption invalidated the fast runs: 'os 18-76 tok/s vistos nesses runs nao valem como benchmark ainda' because cache_on / cache_v3_on / cache_v1_test / debug_dirty returned '????'
session 2026-05-25 transcript · recorded in session transcript - Capacity sweep with the cache active on the 80B (env F51_MOE_CACHE=1, F51_MOE_SCHED_SKIP=1, F51_DEBUG off): C=16 8.09 tok/s, C=32 9.69, C=64 9.95, C=128 9.65 - i.e. the whole cached path tops out around 10 tok/s, a quarter of the uncached --cpu-moe baseline it was meant to beat
session 2026-05-25 transcript (agent report of the harness runs, quoted verbatim) · recorded in session transcript - A later same-day audit listed the conflict explicitly: docs say 40.8 tok/s, an earlier matrix shows ~24 tok/s default, a short local log shows ~5.20 tok/s
session 2026-05-28 (rollout-2026-05-28T17-14-10-019e706f-f40e-7403-93c1-c2d28324656d.jsonl) · recorded in session transcript
Simulator output (the one quantitative artifact whose full output survives)
The 50-scenario run on the 120B trace ranked by hit rate: best 66.85% (dynamic LRU, 13 GiB, 5030 hits / 2494 misses, 61.93 GB avoided), then hot-static per-layer uniform 25-30% at 66.59%, and static-global 30% at 2 GiB at 55.97%. The script's own summary collapses this to a range of 56.0% (every 2-8 GiB budget) to 66.9% (13 GiB). Note there is no 82% in this table - the best number the simulator ever produced is 66.85%, and the mid-range budgets sit at 56%. The same output's router-skew table shows the top 30% of experts account for 82.7% of selections at layer 27 (72.6% for the top 20%, 51.5% for the top 10%), with per-token coverage of the top 10% set at 99.5%. Note what that 82.7% is - a router-skew share, not a cache hit rate. The whole output is published as figure fig-01 on this page, including the 236 corrupted trace lines its own header reports.
- Ranked scenario table with hit rates and hit/miss counts
session 2026-05-30 (rollout-2026-05-30T16-57-00-019e7aad-0816-7200-bf4a-84d9dc434e98.jsonl) · recorded in session transcript - Router-skew table, L27: Top10% 51.5%, Top20% 72.6%, Top30% 82.7%, Top10%AnyTok 99.5%, entropy 0.8088 (and per layer: L28 46.2/66.2/77.9, L29 43.8/66.1/78.2, L30 49.2/68.6/79.3, L31 35.0/54.7/68.2, L32 31.2/50.0/63.1, L33 33.7/53.9/68.0, L34 44.9/67.3/81.3)
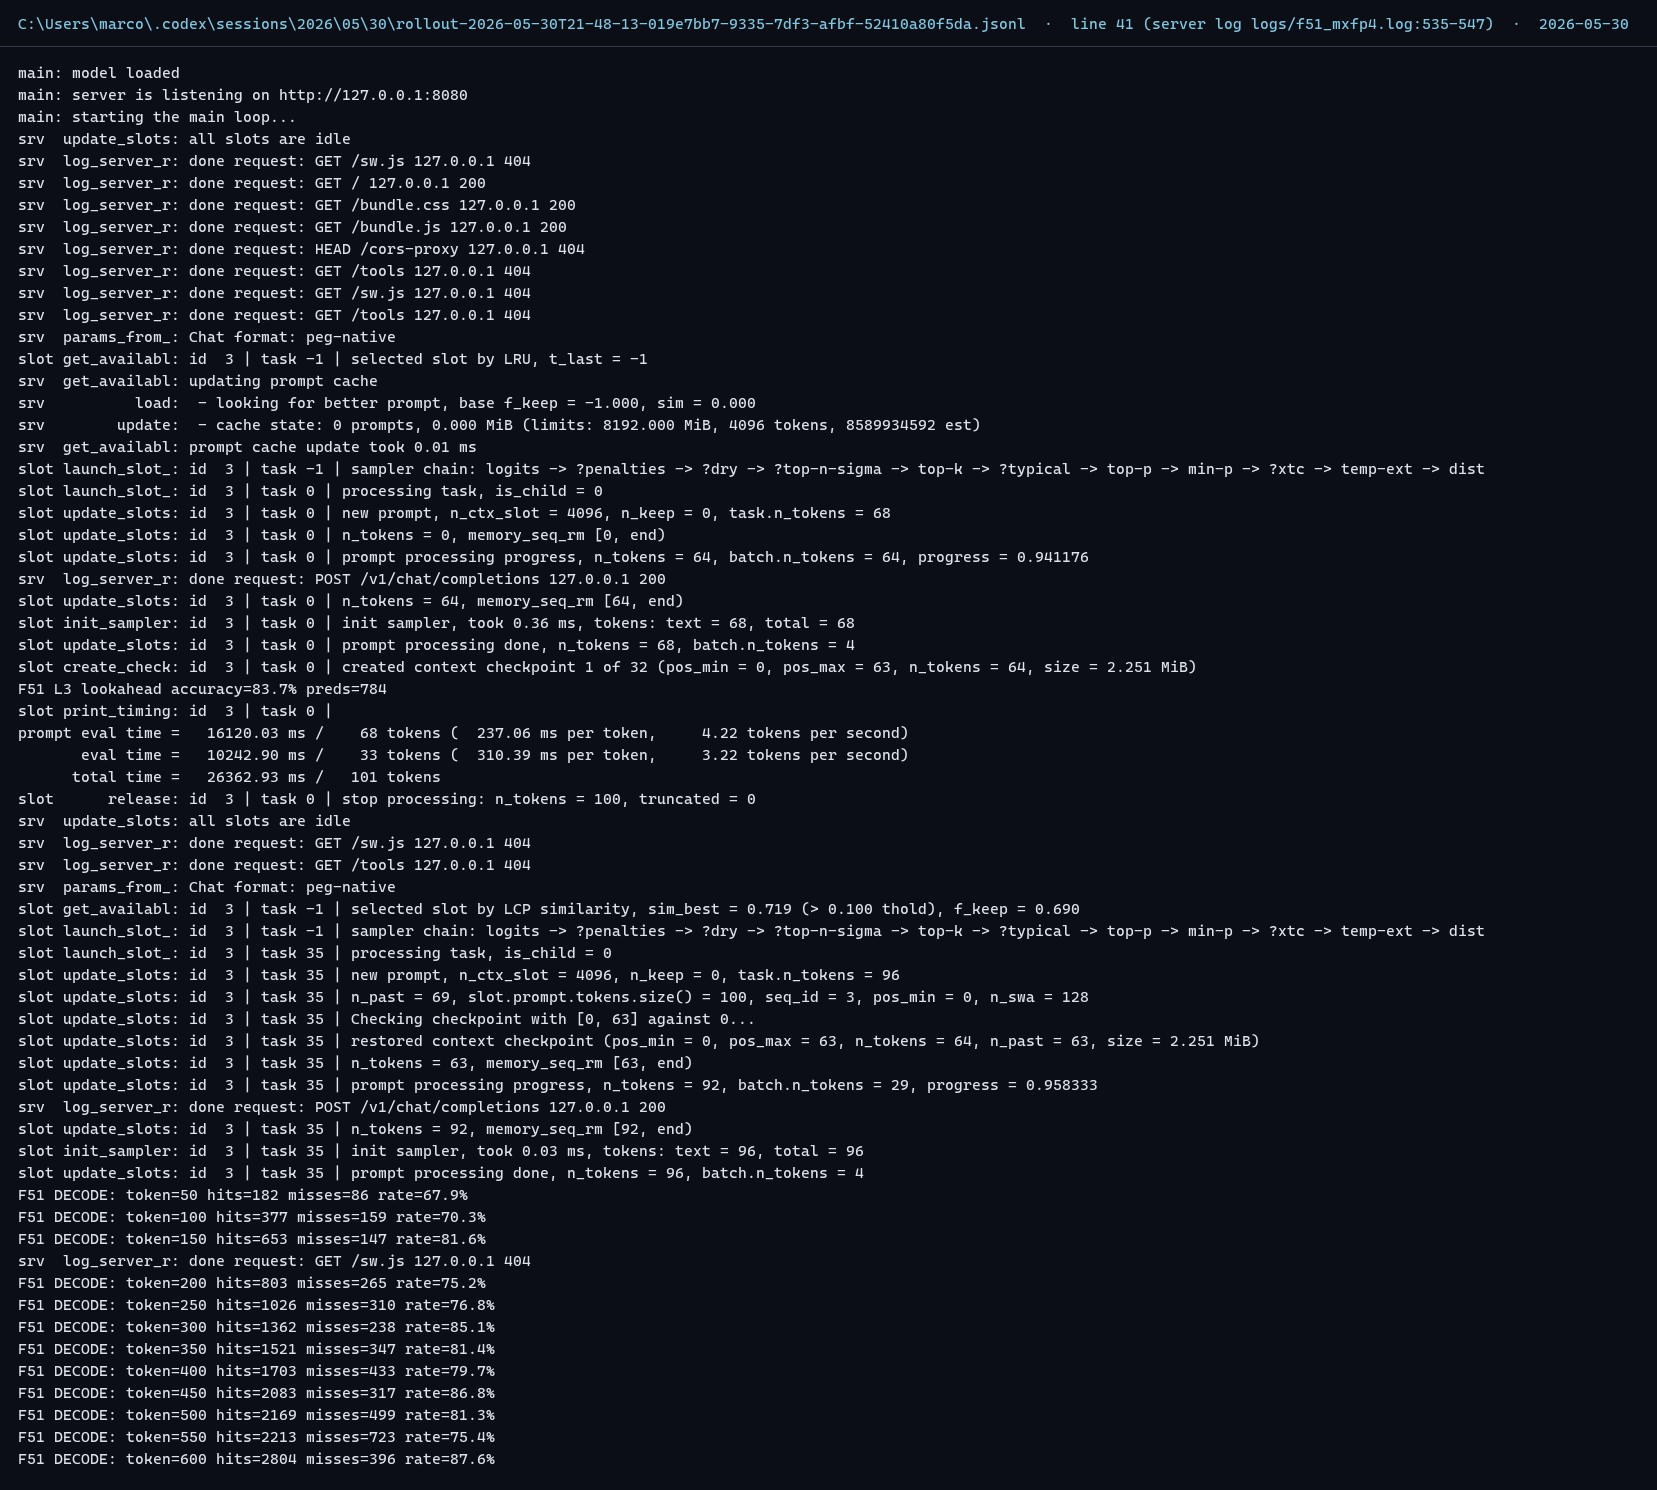
session 2026-05-30, same output; published as figure fig-01 on this page · recorded in session transcript - A live 120B run (GPT-OSS 120B MXFP4) with the cache active logged hit-rate varying between 67.9% and 87.6% across a generation, and an earlier probe at token 50 -> 50.3%, token 500 -> 62.1%
session 2026-05-30 (rollout-2026-05-30T21-48-13-019e7bb7-9335-7df3-afbf-52410a80f5da.jsonl) · recorded in session transcript
Where the 82% actually came from
The 2026-05-29 session answers the question the rest of this page can only argue about. Its Layer-5 analysis prints a table headed 'LAYER 5 - F51 MOE EXECUTOR - PASSA (no papel)' - pass on paper - mapping a cache hit rate to a time per token, a throughput and a speedup against CPU: 30% HR gives 1766 us/token and 566 tok/s; 50% gives 1296 us and 772 tok/s; 67% gives 896 us and 1116 tok/s; 82% gives 543 us, 1840 tok/s and 7.3x; 100% gives 240 us and 4167 tok/s. So in the record 82% is an input to an on-paper projection whose output was 1840 tok/s - not anywhere near the 2 tok/s the only validated run later measured - and it was then quoted downstream as though it were a measured cache hit rate. The same session is explicit that it did not match reality: the agent writes 'agora tenho numero real ... reconciliar o 82% vs 57-67% real', and separately, about a different policy, 'em C=128 chega nos ~82% de hit que voce ja citava no doc' - carried over from a document, not produced by the run. This is the whole reason 82% is withheld on this page: it is a projection constant that escaped its table.
- Projection table 'LAYER 5 - F51 MOE EXECUTOR - PASSA (no papel)': HR 30% -> 1766 us -> 566 tok/s -> 2.3x; 50% -> 1296 us -> 772 tok/s -> 3.1x; 67% -> 896 us -> 1116 tok/s -> 4.4x; 82% -> 543 us -> 1840 tok/s -> 7.3x; 100% -> 240 us -> 4167 tok/s -> 16.6x
session 2026-05-29 (rollout-2026-05-29T16-44-25-019e757b-24c1-7303-a398-755702310e3f.jsonl), line 307; published as figure fig-03 on this page · recorded in session transcript - The session names the discrepancy itself: 'agora tenho numero real. Vou olhar teu simulador pra respeitar a metodologia e reconciliar o 82% vs 57-67% real' and 'E em C=128 o HOTPIN chega aos ~82% que voce ja citava no doc'
session 2026-05-29, line 307 · recorded in session transcript - The same session audits the trace and blocks it. Its table: prefill (top_k=128) 18 lines OK; decode OK (top_k=4, valid ids) 1584 lines OK; decode corrupted (garbage ids) 236 lines BLOQUEIO; layer 35 (last) 188 lines 100% corrupted; layers 27-34 about 13% corrupted each. Root cause recorded as a race in the router_trace_minimal.patch reading the ids tensor through ggml_backend_tensor_get_async() before synchronize() completed
session 2026-05-29, line 307 · recorded in session transcript - The session's own corruption totals do not reconcile, and this page does not pick a winner: the table accounts for 236 + 188 = 424 bad lines, while a parser run earlier in the same session reports valid_rows=1475 out of 1838, i.e. 363 invalid, and the prose repeats '363 invalidas'. Either figure still disqualifies the trace as the basis for a published hit rate
session 2026-05-29, lines 80, 86 and 307 (comparison made 2026-10-03) · recorded in session transcript; arithmetic by F51 Labs
The last validated checkpoint
The final packaged validation, on 2026-05-31 (GPT-OSS 120B MXFP4, kit 'safe5'), started cleanly, passed /health and /completion, and showed the F51 cache active in the server logs. Measured throughput: prompt eval 1.88 tok/s, generation 2.00 tok/s (64 tokens in 35.82 s). The summary was written to .../F51-Nitro-MoE/evidencias/validation/20260531_2226_safe5/validation_summary.json. The same conversation states plainly that what got proven that day was the 120B path, not a speedup.
- 'o que esta provado agora e ~2 tok/s, nao 22 tok/s ... F51 cache apareceu ativo nos logs. Mas throughput medido foi 2 tok/s'
session 2026-05-31 (rollout-2026-05-31T22-02-05-019e80ea-b4d5-72b0-8da6-27bbf39ec069.jsonl) · recorded in session transcript - Evidence path for that run: (local source: validation_summary.json)
same session, quoted path · artifact deleted from disk; path recorded - On 2026-06-02 internal documents are cited as claiming 38.7-42 tok/s while the running process delivered 14-20 tok/s, and the F51 engine is identified as C:\llama.cpp\build-cuda\bin, version 3 (579fe01), branch f51-nitro-layer1
session 2026-06-02 (rollout-2026-06-02T12-42-40-019e8937-2d37-7dc0-bf73-ec2411450c21.jsonl) · recorded in session transcript
The control
The honest comparison in this project is not cache-on versus cache-off; it is three execution modes of the same 80B model, and the finding that the cheapest-looking one is the worst.
GPU-all is the worst mode for this model
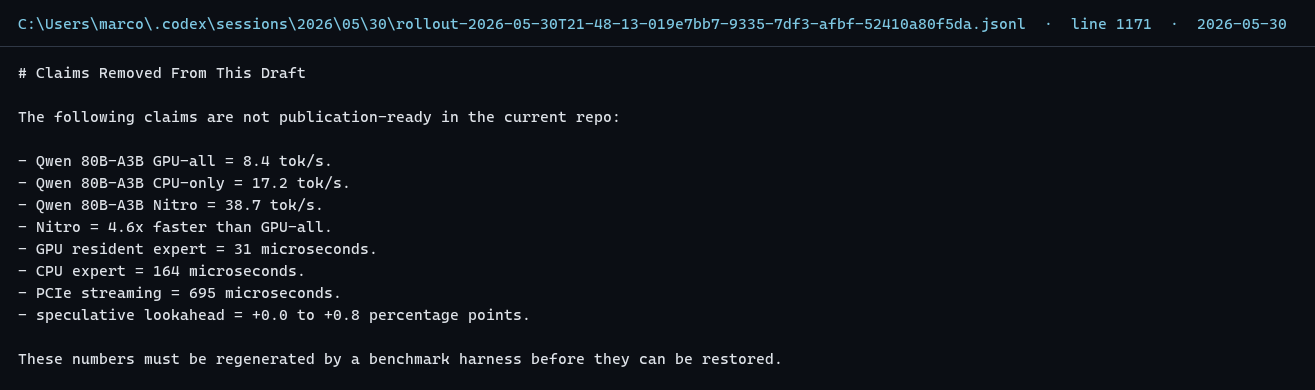
Recorded across the session trail and the notes: 80B GPU-all 8.41 tok/s at 15.9 GB VRAM (saturated, collapsed); 80B CPU-only 17.18 tok/s at 0 GB VRAM; 80B in Nitro mode 38.67 tok/s at 2.4 GB VRAM - described at the time as 4.6x GPU-all and 2.3x CPU-only. The last number is the one that is mislabelled: the runs behind it are --cpu-moe with the cache not engaged (see The result), so it is a CPU-compute baseline, not a cache result. It is listed under missing[] for exactly that reason.
- Mode comparison: GPU-all 8.41 tok/s, CPU-only 17.18 tok/s, 'Nitro' 38.67 tok/s at 2.4 GB VRAM
session 2026-05-25 transcript, quoting the project whitepaper docs/F51_NITRO_MOE_WHITEPAPER.md (file deleted) · recorded in session transcript; source file no longer on disk - Independent note of the same baseline in memory: '80B Nitro 256K: 39.22 tok/s, 6.3 GB VRAM; GPU-all 80B: 8.41 tok/s; prompt real 240K: 309.91 tok/s prefill, 25.72 tok/s gen'
memory/nitro-moe-protocol.md (2026-05-25) · recorded in project memory - Two benchmark runs on the 80B recorded in the checkpoint note: T01 64K, 4.6 s, 138,199 prompt tokens, 128 completion; T02 64K, 4.3 s; prefill ~242 tok/s, generation ~39-42 tok/s
memory/nitro-80b-checkpoint.md (2026-05-25) · recorded in project memory
Negative results recorded alongside
Two adjacent ideas were measured and killed inside the same programme and are still published on the MIKE page: PCIe expert transfer (695 us of transfer against 164 us of CPU compute - not viable) and speculative prefetch as originally designed. No surviving file carries those two numbers; they appear only in the site's own audit text and the generated page. They are therefore also listed under missing[].
- PCIe streaming (695 us vs 164 us) and speculative prefetch listed as dead ideas
analysis/mike_product_analysis.txt:73-74 (2026-08-08); generated page ai/mike/index.html · present in site documents; underlying measurement file not found - The project's own audit called the research line accurate at the time: 'Nitro-MoE: ACCURATE (proven research with real numbers)'
analysis/site_vs_reality_gap.txt:415 (2026-08-08) · present in site documents; the numbers it referred to are not on disk
The limits
Everything below is about what does not exist, and it is the reason this page contains no 82% and no 38.7 tok/s as results.
The source tree and every measurement log are gone
On 2026-10-03, Test-Path returns false for C:\llama.cpp, C:\F51_LAB, (local source: SuperEzio-Arbitro), (local source: F51-Nitro-MoE) and (local source: F51-Darwin-NITRO.) That removes f51_cache_sim.py, f51_nitro.cuh, the patched common.cuh and ggml-cuda.cu, f51_stderr.log (recorded at 17,626 bytes on 2026-05-25 and 71,706 bytes on 2026-05-26), the whitepaper and the four Layer-1 docs, and the 2026-05-31 validation JSON. The only reason any of their content can be quoted here is that the Codex session records kept the terminal output. The Darwin-CL audit of 2026-07-17 had already recorded the Nitro folders as MISSING.
- f51_stderr.log file listing with sizes and timestamps
session 2026-05-25/26 transcript (Get-ChildItem output) · recorded in session transcript - Repo docs that existed: docs/F51_NITRO_MOE_WHITEPAPER.md, F51_NITRO_BENCHMARK_PROTOCOL.md, F51_LAYER1_IMPLEMENTATION.md, F51_NITRO_AGENT_REFERENCE.md, plus f51_cache_sim.py at the repo root
session 2026-05-26 (rollout-2026-05-26T20-01-49-019e66bc-b825-7e72-99aa-c558521cc84e.jsonl) · file list recorded; files deleted
verified on disk
What is public
A public llama.cpp fork exists at github.com/marcobarreto007/llama.cpp. Checked on 2026-10-03: the default branch is master, the repository lists 11,046 commits, and neither the branch listing nor the root file listing contains anything named f51 or nitro. The branch the sessions name - f51-nitro-layer1 - is not public. There is no Nitro-MoE paper, DOI, release or pull request. The project's own research page says 'No public link yet', which remains true.
- Public fork exists; no f51/nitro branch or file visible in the branch pages or root listing
github.com/marcobarreto007/llama.cpp, checked 2026-10-03 · verified on the public page - Local engine branch was f51-nitro-layer1, version 3 (579fe01), under C:\llama.cpp\build-cuda\bin
session 2026-06-02 transcript · recorded in session transcript; local repo deleted
No figure survives as a project artifact
Nothing image-like was made by the project: no PNG, SVG, JPG or diagram survives in any directory, and none is referenced in the session records as an attachment. The only quantitative visual the project ever had was a terminal table. The six figures on this page are therefore F51 Labs renders of the surviving terminal text, made on 2026-10-03 and labelled as such in every caption - they are quotations, not artifacts. Each has a byte-literal .txt companion and is re-verified against the source session record by assets/nitro-moe/_build/verify_literal.py.
- No project-made image file exists for F51 Nitro on this machine; the six published figures are F51 Labs renders of session text with literal .txt companions
filesystem search on 2026-10-03; assets/nitro-moe/_build/gen_extracts.py and verify_literal.py · verified on disk
Where the work stopped
The last F51-cache session on this machine is 2026-06-02 (the 14-20 tok/s run and the f51-nitro-layer1 branch identification). The last note written is dated 2026-05-28 (Musical Chairs / F51_PIN_EXPERTS). The 2026-06-14/15 sessions that mention an 80B are about the SuperEzio/Arbitro product, not the cache line. So the line has been stopped for roughly four months as of 2026-10-03, and the artifacts were deleted at some point after the June sessions and before the July 2026 Darwin audit that already recorded the folders as missing.
- Last session with F51 cache content: 2026-06-02; last project note: 2026-05-28
timeline of (local source: 05-06) matching f51_cache_sim / f51_stderr / F51_MOE_CACHE · verified by file dates and transcript contents